News
BEA Releases 2023 Hanover County GDP Data
December 5, 2024
News
December 5, 2024


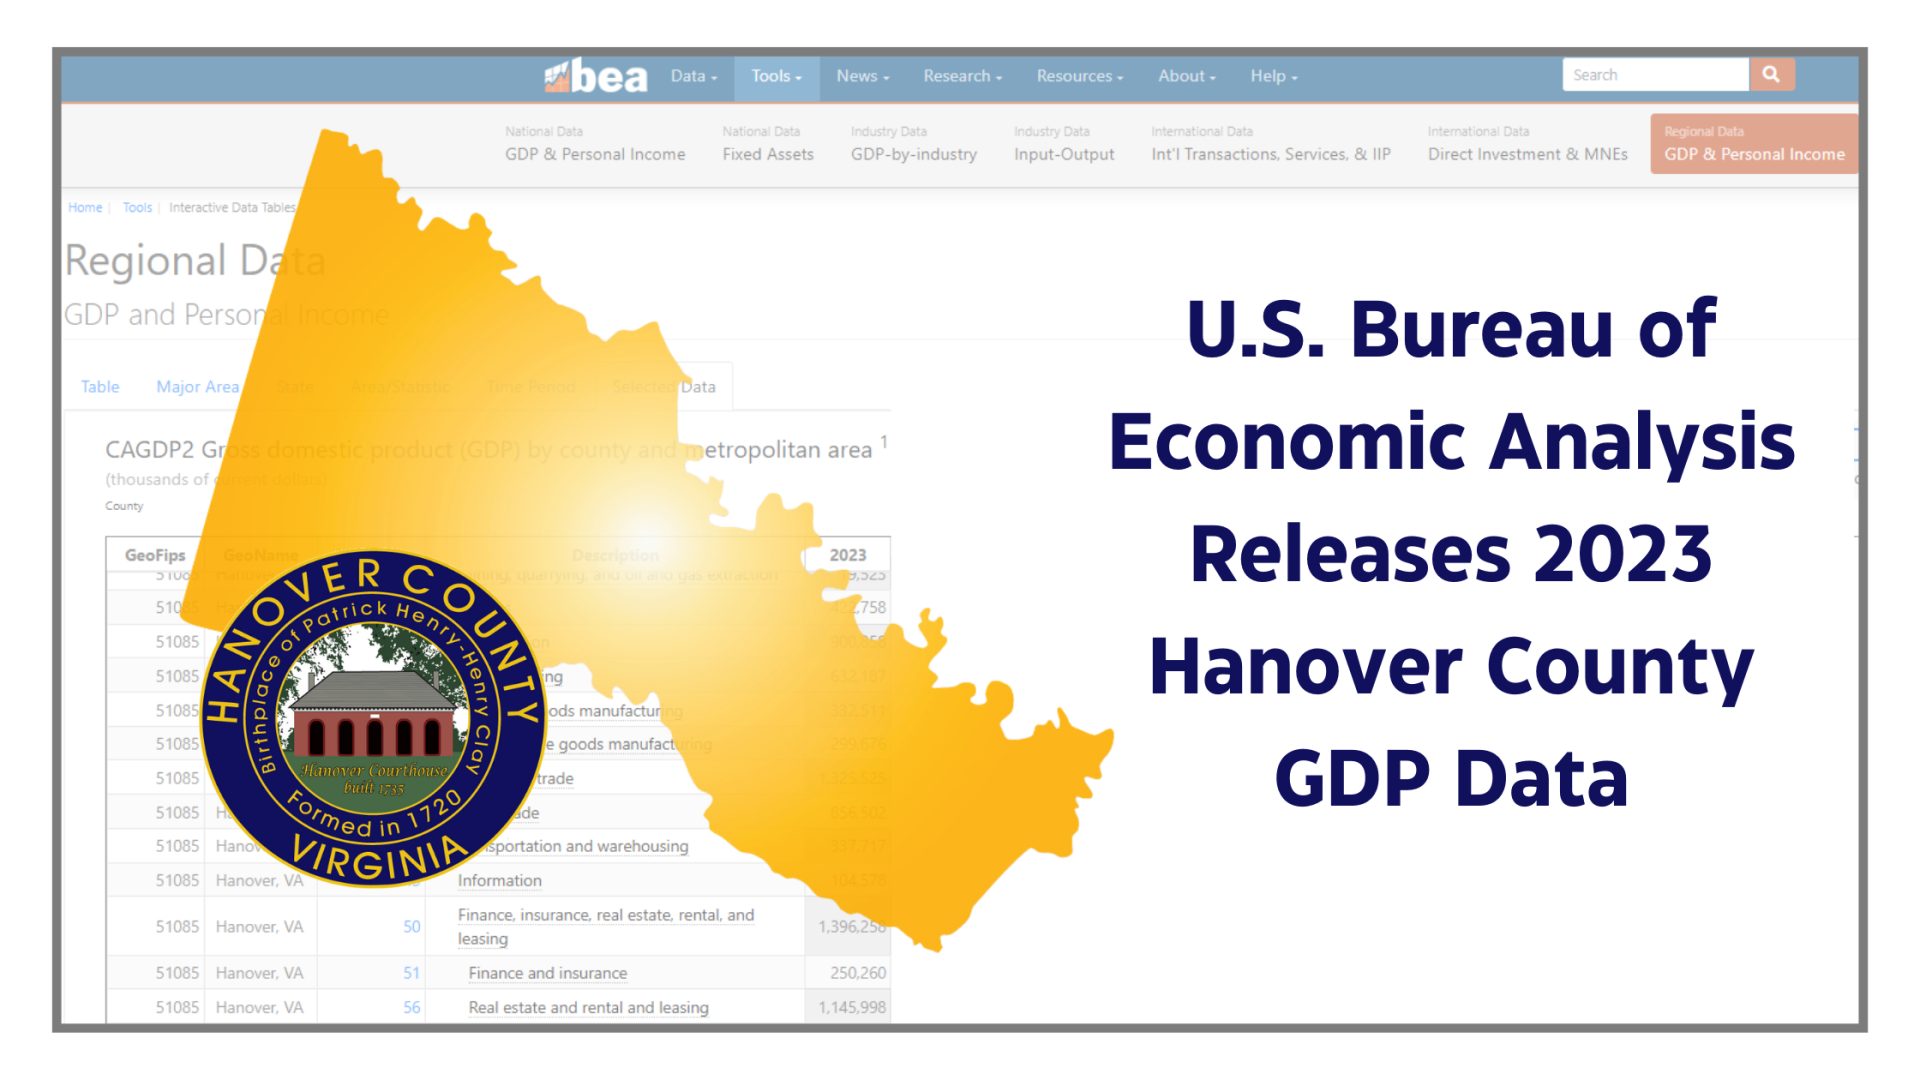
The United States Bureau of Economic Analysis (BEA) released the 2023 update of Gross Domestic Product (GDP) by county and metropolitan area on December 4, 2024. The annual estimates of GDP by county and metropolitan area from 2019 to 2022 were also revised.
GDP measures the value of final goods and services produced within the a community. These are goods and services produced by private industry and government, less the value of goods and services used up in production. GDP is also equal to the sum of personal consumption expenditures, gross private domestic investment, net exports of goods and services, and government consumption expenditures and gross investment. The size of a county’s economy as measured by GDP varies considerably across the United States. In 2023, the total level of real GDP ranged from $17 million in Petroleum County, MT, to $802 billion in Los Angeles County, CA.
In Hanover County, the nominal 2023 GDP (based on current market prices in U.S. dollars) is $8.67 billion and ranks Hanover as the 19th largest economy of 105 Virginia jurisdictions. This figure represents a 7.8% increase from 2022. Over the past ten years, Hanover County has realized positive nominal GDP growth with the largest increases realized in 2021 (11.3%) and 2022 (14.32%). The Richmond Metropolitan Statistical Area (MSA), of which Hanover is part of, has also realized positive increases in each year over the last decade.
Adjusted for inflation, real GDP is considered a more accurate representation of underlying economic activity and is often an indicator of the health of the economy. It is calculated using constant prices, which removes the effect of price changes and inflation over time. Hanover’s 2023 real GDP (reported in chained 2017 dollars) is $6.7 billion representing a 2.8% increase over calendar year 2022. Following the trend set with the nominal GDP in 2021 and 2022, Hanover’s real GDP realized 5.5% increases in each of these reporting periods.
| Industry Sector | % of Total GDP | 2023 Industry GDP |
|---|---|---|
| Finance, insurance, real estate, rental, and leasing | 16% | $1,396,258,000 |
| Wholesale trade | 15% | $1,325,525,000 |
| Construction | 10% | $900,858,000 |
| Retail trade | 10% | $856,502,000 |
| Professional and business services | 10% | $840,646,000 |
| Educational services, health care, and social assistance | 8% | $672,778,000 |
| Manufacturing | 7% | $632,187,000 |
| Government and government enterprises | 7% | $574,694,000 |
| Utilities | 5% | $422,758,000 |
| Arts, entertainment, recreation, accommodation, and food services | 4% | $360,807,000 |
| Transportation and warehousing | 4% | $337,717,000 |
| Other services (except government and government enterprises) | 3% | $218,729,000 |
| Information | 1% | $104,578,000 |
| Mining, quarrying, and oil and gas extraction | <1% | $19,523,000 |
| Agriculture, forestry, fishing and hunting | <1% | $12,756,000 |
| Total 2023 Hanover County Nominal GPD | 100% | $8,676,316,000 |